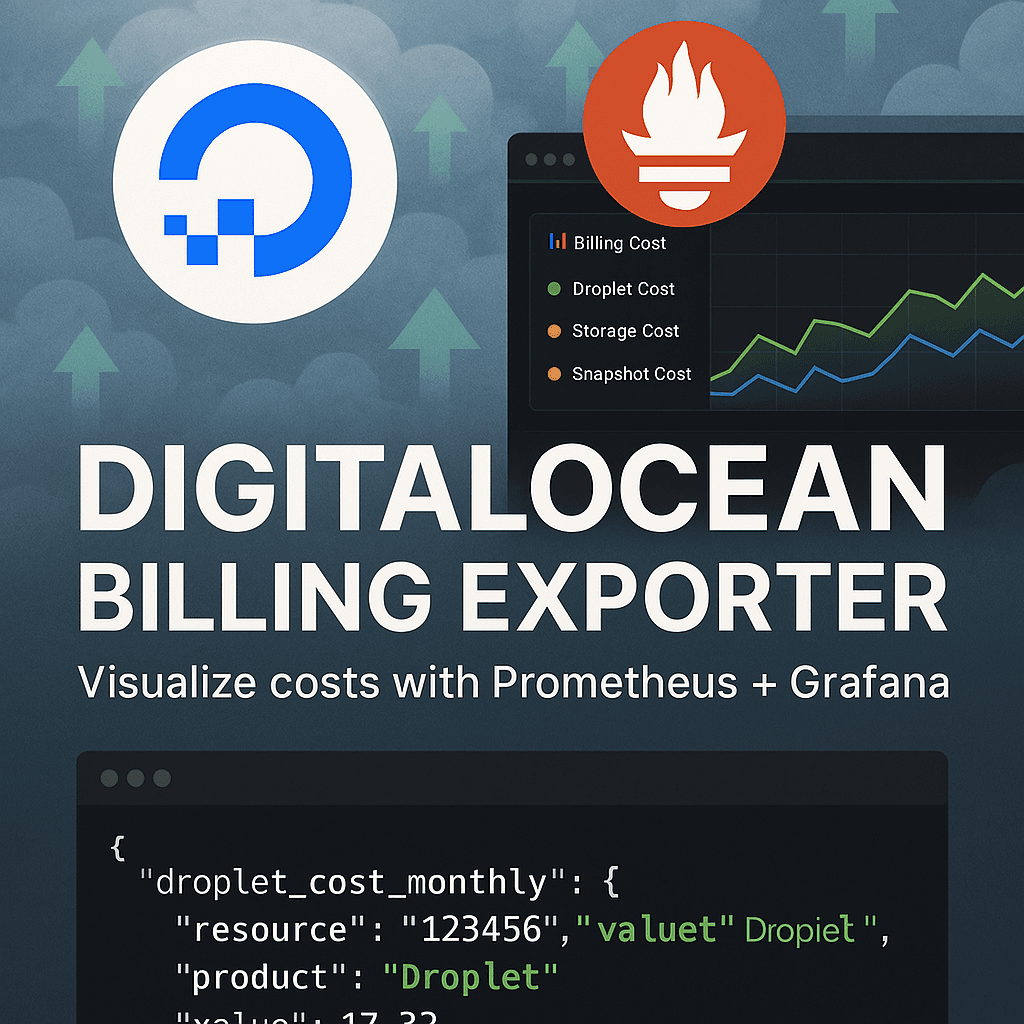
DigitalOcean Cost Explorer
Apr 12, 2025
Moving from AWS to DigitalOcean
Most of my experience in DevOps is mostly on AWS, but recently we started using Digital-Ocean. AWS has better SLA and more services to make your life easy as a platform engineer / Devops engineer.
But everything comes at a price, AWS has very high costing when it comes to network traffic (egress cost) which becomes a concern when working with blockchain because amount of data egress is huge due to p2p.
But one of the things that AWS does it well is cost explorer, a single service from where you can easily track cost per region and also narrow it down to a single instance.
This is a major missing in digitalocean, infra without a monitor is like flying blind — you might not see the crash coming until it’s too late.
How to track your DigitalOcean cost without going for 3rd party tools
So I wrote a custom exporter to export my infra cost in form of prometheus metrics on a endpoint which can be viewed on Grafana after scraped by prometheus.
Follow these steps to easily setup this on your system:
Clone this repository on your machine
then run the executable file as per your CPU (if you are on ubuntu it will be x86)
Add your api token to the command and then you are good to go.
It will expose metrics on port 8000 by default you can change the port by passing --port flag.
if you feel like adding to my exporter you can go and check the /src folder for python script.
Thanks